New Paper On Li Stephens
Today we posted a new paper on the Li-Stephens (LS) haplotype copying model. LS is a beautiful technique for approximating the likelihood of a sample of whole genome sequence data, which is otherwise very hard to evaluate because of the astronomically large number of ancestry scenarios that could have generated the data. If you work in stat gen, chances are good you have used this model, perhaps without realizing it, since it underpins a lot of other extremely popular computational methods, including IMPUTE, SHAPEIT, EAGLE, fastPHASE, and maCH. For a brief summary of the method and all its applications, see this review paper by Yun Song, or just read the original paper, which is very nice and not too technical.
As with any pop gen method, the output of the LS algorithm depends on some population genetic parameters, in this case the rates of recombination and mutation. We were curious how the output of the LS algorithm changes in response to perturbations in these parameters. Answering this question rigorously turns out to be statistically and mathematically interesting, with connections to convex analysis and changepoint detection. It’s also practically important since, presumably, the performance of the many algorithms founded upon LS depends on setting these parameters in an optimal way.
Our contribution here is to derive an efficient algorithm for uncovering all of the possible solutions to the LS algorithm in a single run. This is akin to what the LARS algorithm does for the LASSO problem (\(\ell_1\) penalized regression). Unlike regression, in practice, the “answer” to LS is not known (and potentially not even defined), but using simulations and our algorithm, we can study how different parameterizations affect the ability to do certain tasks like imputation and phasing.
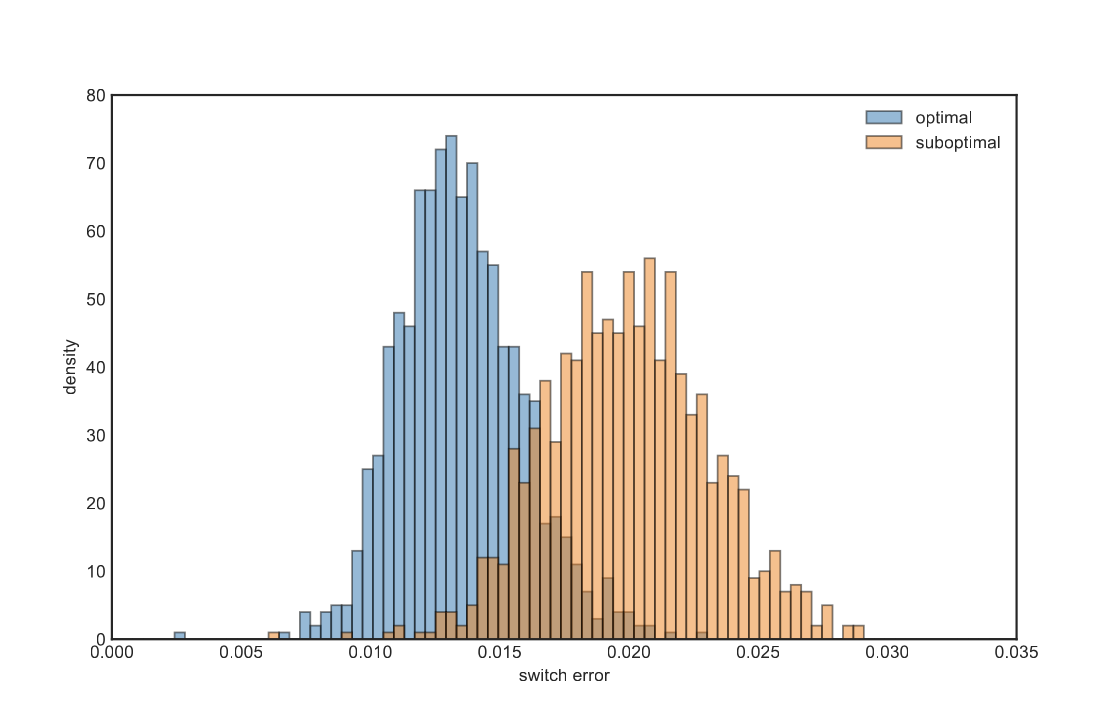
One interesting finding from our paper is that using the “population-scaled” rates of recombination and mutation might actually be suboptimal, at least for some problem instances. In the graphic below, we compared the distribution of switch errors committed by a haplotype phasing algorithm over repeated simulations. The orange histogram is the distribution when the population-scaled values are used. The blue histogram is what we get by using our algorithm to figure out the best possible settings for these parameters in each run. At least on the simulation considered here, there is a gap of a few percentage points in switch error that could possibly be erased by parameter tuning.